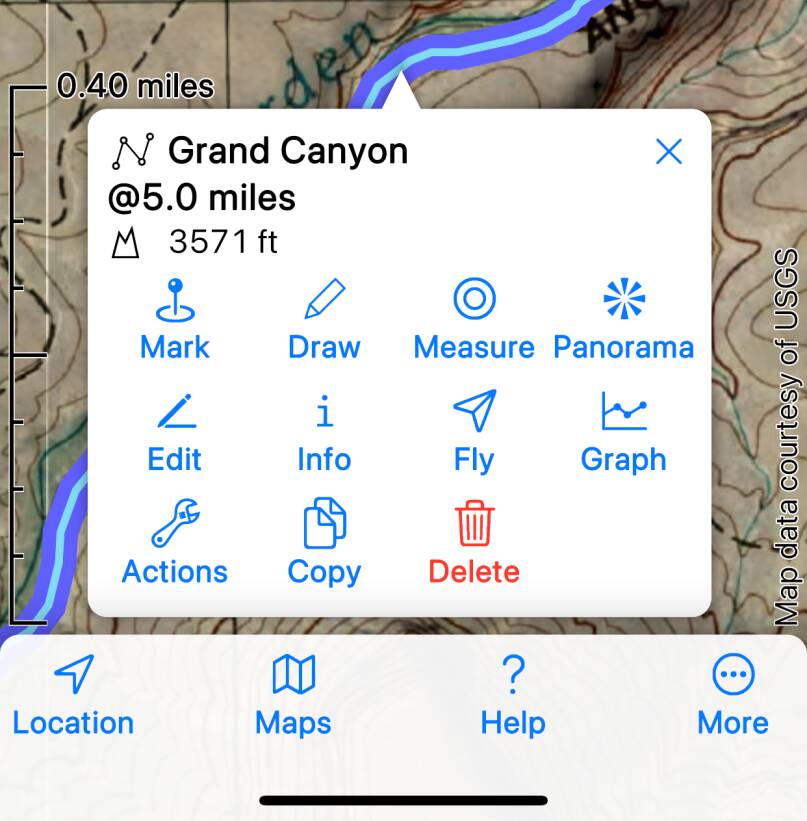
To plot a graph for a track or route, select it and tap .
You can add multiple tracks or routes; just select more and tap the same button.
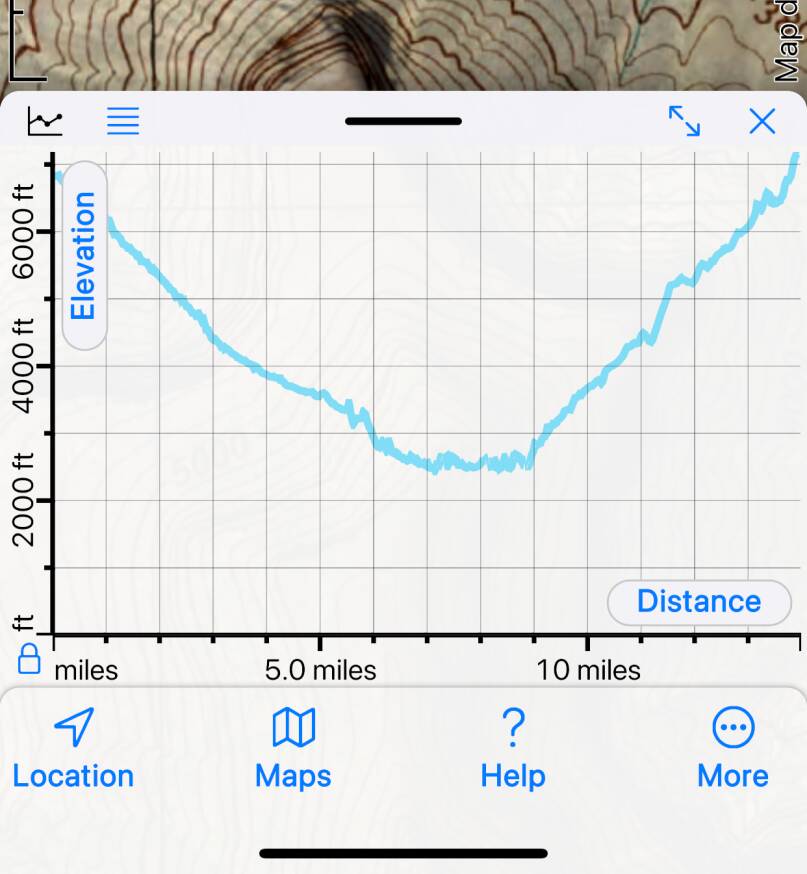
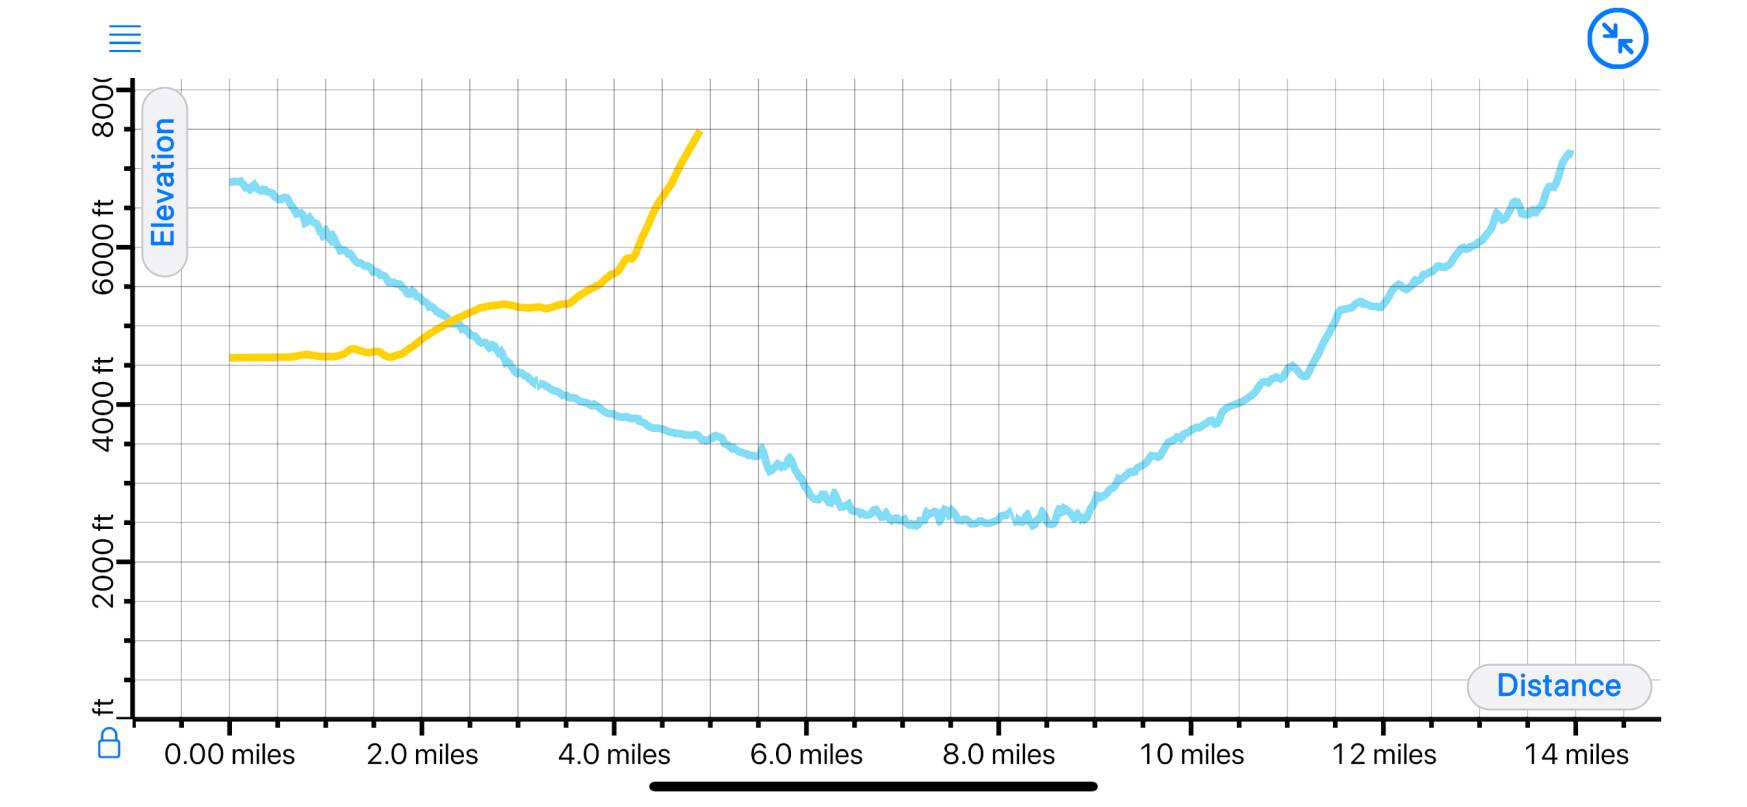
Tap to expand to full screen. This works well on
an iPhone rotated to landscape orientation.
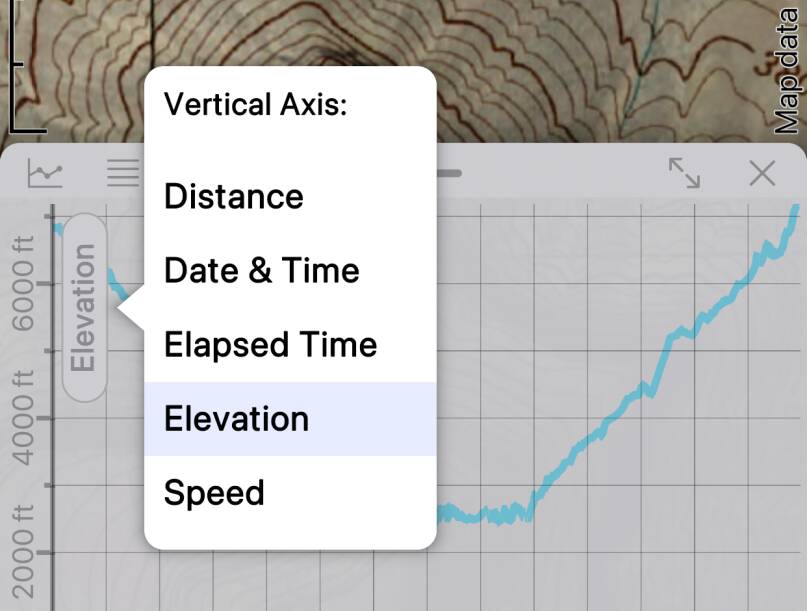
Available Axes
Available vertical axes are elevation, speed, distance, date & time and elapsed time
- but not all axes are available for all tracks and routes. For example a recorded track
will normally include timestamps, but if you have just drawn a route on the map it won’t
have them.
Available horizontal axes are distance, date & time and elapsed time -
again subject to what data is actually present in the track or route.
Change the axes by tapping on the buttons next to each axis.
Pan and Zoom
Pan and zoom horizontally with the usual touch gestures on the body of the graph.
To pan or zoom the vertical axis you need to touch on the vertical axis, at the left
of the screen.
Note the / button at the
bottom left corner of the graph. When this is locked, the vertical axis is anchored to start
at zero. This is appropriate for speed, and for elevation if you’re not too far from the ocean.
When it’s unlocked the vertical axis doesn’t have to start at zero - this is good for,
for example, hikes in Colorado.
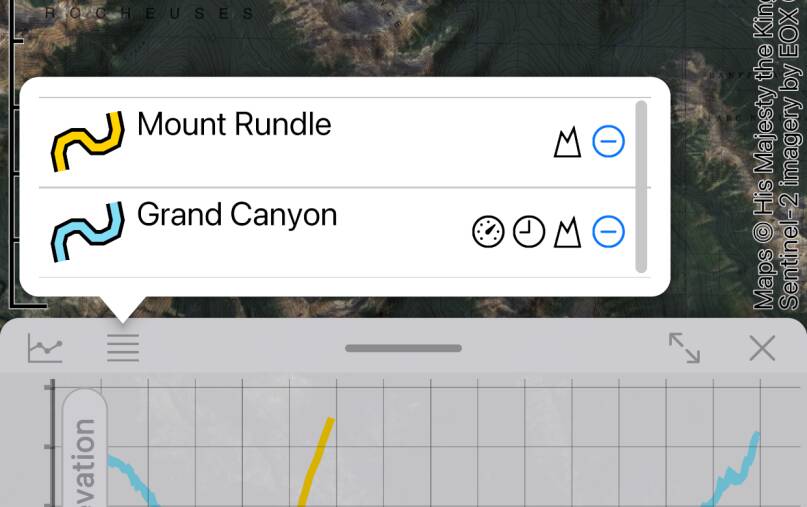
The Graph List
At the top left of the graphs window, the button shows
a list of the currently added tracks and routes. Tap
to remove one. You can also drag items in this list to re-order them, which determines
which is drawn on top where they overlap.
Symbols indicate which data is available in each case, i.e. which axes will be available:
![]() : speed,
: speed, ![]() : date & time,
: date & time,
![]() : elevation.
: elevation.
 : speed,
  : date & time,
 : elevation.
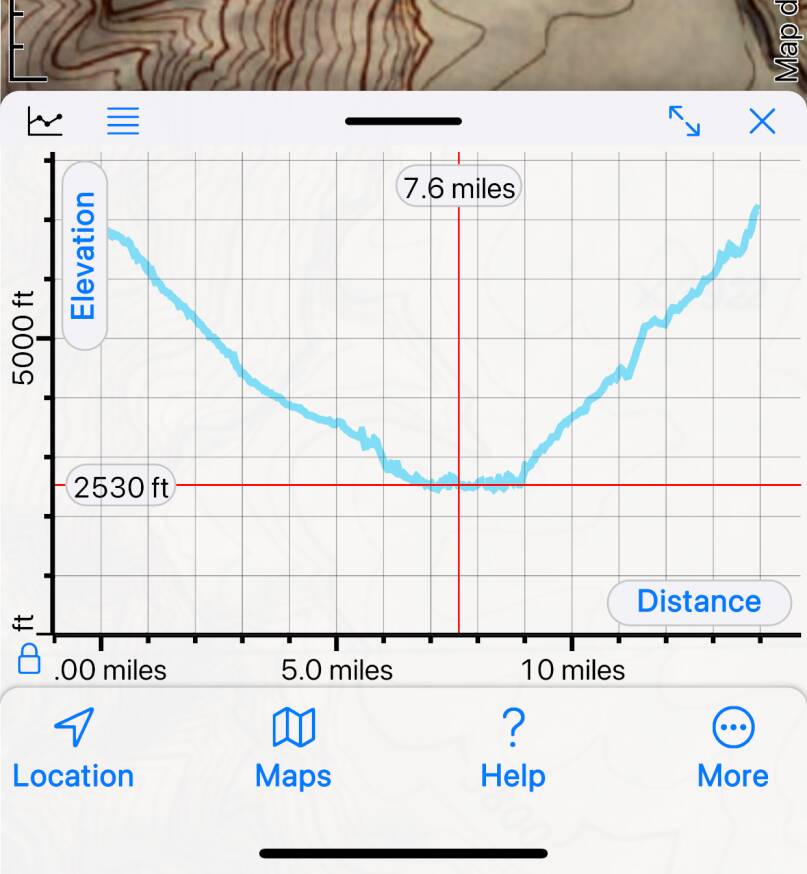
Cursors
If a point on a track or route is selected on the map, the corresponding point on the
graph is indicated by red horizontal and vertical cursors. The selected point can be
moved by dragging the value indicator at the top of the vertical cursor line. Use
this to match locations on the map and graph, for example to find the location of the
highest or fastest point.
Current Location
If you have turned on Location (), a location spot
may be shown on the graph view as well as on the map. If you’re following a route,
this will show the closest point on the route to your current location.
If you’re near but not exactly on a displayed track or route, and if one or other
axis is distance, then the location spot may be shown above the graph, joined to it
with a thin blue line. The length of this line represents your distance from the
track or route.


